Scottsdale and Phoenix Housing Market Update: September 2026
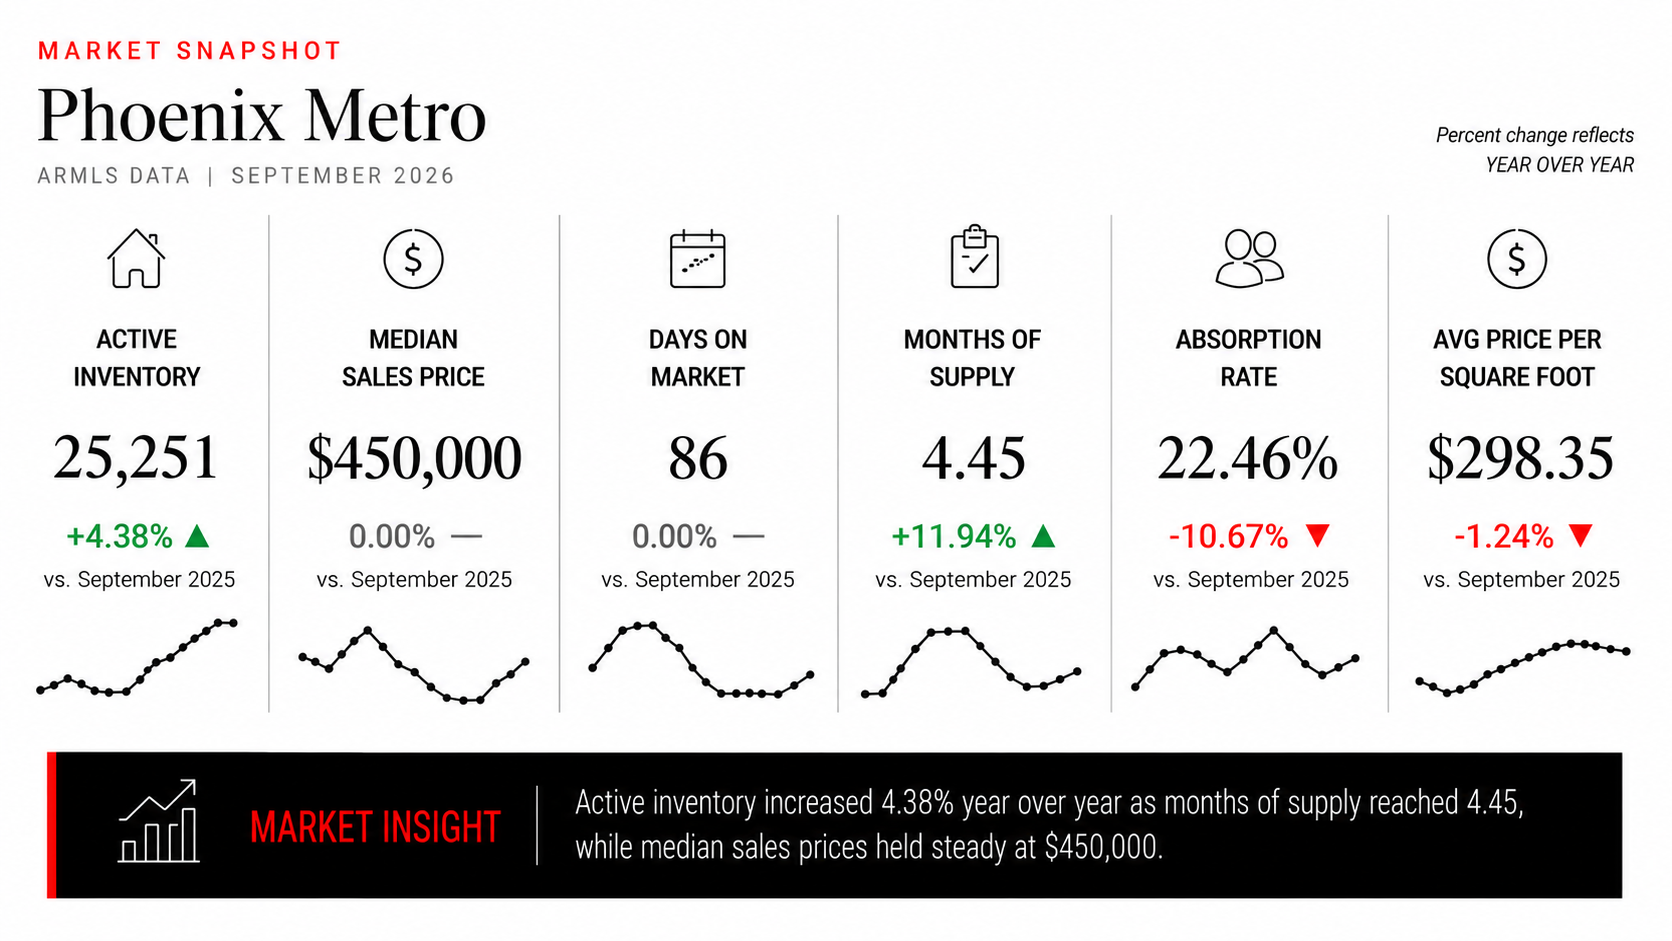
The number that stands out to me from September is 25,251 active listings, up 7.86% from August and 4.38% from September 2025. At the same time, homes under contract fell 10.39% month over month. More properties became available while fewer moved into the contract pipeline, which tells us something important about where the Phoenix-area market is heading this fall.
Months of supply increased to 4.45, the highest reading in the past three months, while the absorption rate dropped to 22.46%. Buyers have more choices, but higher mortgage rates are making those choices harder to act on.
There was some improvement in completed sales. September recorded 5,672 closings, up 2.20% from August, and the median sales price recovered to $450,000. Those are encouraging numbers, but I would be careful about calling them a market rebound when pending activity is moving in the opposite direction.
In my August 2026 Scottsdale and Phoenix Housing Market Update, I noted that under-contract activity had improved despite weaker closings. September reversed that pattern. Closings increased modestly, but the number of homes under contract fell sharply. That difference is worth watching because September's completed sales largely reflect decisions made before the latest increase in mortgage rates.
The National Housing Market in September
September brought a noticeable shift in the national housing market as mortgage rates climbed above 7% for the first time since January 2025. According to Realtor.com's September 2026 Housing Trends Report, the 30-year mortgage rate increased from 6.66% in the final week of August to 7.03% on September 24.
That increase matters more than it might initially appear. Realtor.com estimates that the rate movement reduced purchasing power by approximately $11,500 for a buyer working with a fixed monthly budget.
The national median list price fell to $419,250, down 1.4% year over year and 1.2% from August. This marked the eleventh consecutive month of annual declines in asking prices. Median list price per square foot also fell 1.7% from September 2025.
Inventory continued moving in the opposite direction. Active listings reached approximately 1.16 million homes, an increase of 5.4% year over year. That brought national inventory within 9.1% of typical pre-pandemic levels, the smallest gap recorded since the pandemic.
The clearest sign of seller pressure came from price reductions. Nationally, 20.8% of listings had a price cut in September, up 0.9 percentage points from a year earlier. It was the highest monthly share since October 2022 and the highest September reading since 2018.
Demand also weakened. The number of homes in pending status declined 4.1% year over year and 6.2% from August. Median time on market reached 61 days, just one day longer than August and one day shorter than September 2025.
What stands out to me is the combination of rising inventory and falling pending activity. Homes are accumulating faster than buyers are committing to them. The increase in price reductions suggests sellers are beginning to respond, but September's contract numbers show that lower asking prices alone have not been enough to offset affordability concerns.
Phoenix Metro: What Changed in September
The September ARMLS STAT report provides a closer look at the Phoenix-area housing market. These figures cover ARMLS listing activity, which extends beyond Scottsdale and varies by area. I use them as a regional benchmark rather than a direct measurement of any individual Scottsdale neighborhood.
Closed sales increased from a revised 5,550 in August to 5,672 in September, a 2.20% improvement. Compared with September 2025, however, closings were down 6.76%.
New listings increased substantially. September recorded 9,350 new listings, up 15.03% from August and 3.08% year over year. Active listings, excluding UCB and CCBS properties, reached 25,251, an increase of 7.86% for the month.
The contract pipeline weakened considerably. Pending, UCB, and CCBS listings fell from 6,759 in August to 6,057 in September. That represents a 10.39% monthly decline and a 10.28% decrease from September 2025.
Months of supply increased from 4.22 in August to 4.45 in September, a 5.54% monthly increase. Compared with September 2025, supply was 11.94% higher. The absorption rate declined from 23.71% to 22.46%, down 10.67% year over year.
Prices were more stable than the inventory and contract numbers might suggest. The median sales price increased from $445,000 to $450,000, up 1.12% for the month and unchanged from September 2025. Average sales price increased 1.43% to $586,246, which was 1.97% above a year earlier.
Median days on market improved slightly from 64 to 63 days. That was also three days shorter than September 2025, although the average remained at 86 days.
Source: ARMLS STAT, September 2026, published October 6, 2026. ARMLS revised certain August figures from its prior report, so the month-over-month comparisons above use the September report's updated historical values.
September's Inventory Increase Is Different From August
This is the most important distinction between the two months.
In August, months of supply increased largely because fewer homes closed, even though active inventory declined. September was different. Active inventory increased by 1,841 listings, while completed sales actually improved slightly.
That tells us September's increase in supply was not simply the result of fewer closings. More homes were entering the market, and fewer were moving into the contract pipeline.
New listings rose by 1,222 properties from August. Meanwhile, the under-contract count fell by 702. The gap between those two movements helps explain why buyers are seeing more choices as the fall market develops.
The absorption rate reinforces that reading. At 22.46%, September's rate was down from 29.53% three months earlier. In other words, the market is absorbing a smaller share of its available inventory than it was at the beginning of summer.
I would not interpret that as evidence that homes are no longer selling. September still recorded 5,672 closings, and median days on market actually improved slightly. But the relationship between available inventory and pending demand has changed enough that sellers need to pay attention.
What the September Numbers Mean for Scottsdale
Realtor.com's Phoenix-Mesa-Chandler metropolitan data provides another useful perspective, although this geography includes communities well beyond Scottsdale.
In September, the metro's median list price was $475,000, down 4.8% from a year earlier. Active listings increased 7.5% year over year, while new listings rose 3.6%. Median list price per square foot fell 1.9%.
The most significant figure is the share of listings with price reductions. In Phoenix-Mesa-Chandler, 29.0% of listings had a price cut in September, compared with 20.8% nationally. That was also two percentage points higher than September 2025.
Nearly three in ten listings had been reduced. That does not mean every property is overpriced, but it tells us that a substantial portion of sellers have already adjusted their expectations.
The metro's median time on market was three days shorter than a year ago, which is an important counterpoint. More price reductions do not automatically mean every property is taking longer to sell. Sellers who respond to market conditions may still find buyers, while properties that remain poorly positioned can face more competition.
For Scottsdale specifically, I would be cautious about applying the metro's 4.8% annual decline in asking prices to every home. Scottsdale Country Club, McCormick Ranch, Arcadia, and North Scottsdale have different housing stock and buyer profiles.
A fully remodeled home with a desirable floor plan may compete against a very limited group of comparable properties. An older home requiring significant updates may face a much broader set of alternatives.
The metro numbers tell us buyers have more negotiating opportunities. They do not tell us how much any particular Scottsdale property should be discounted.
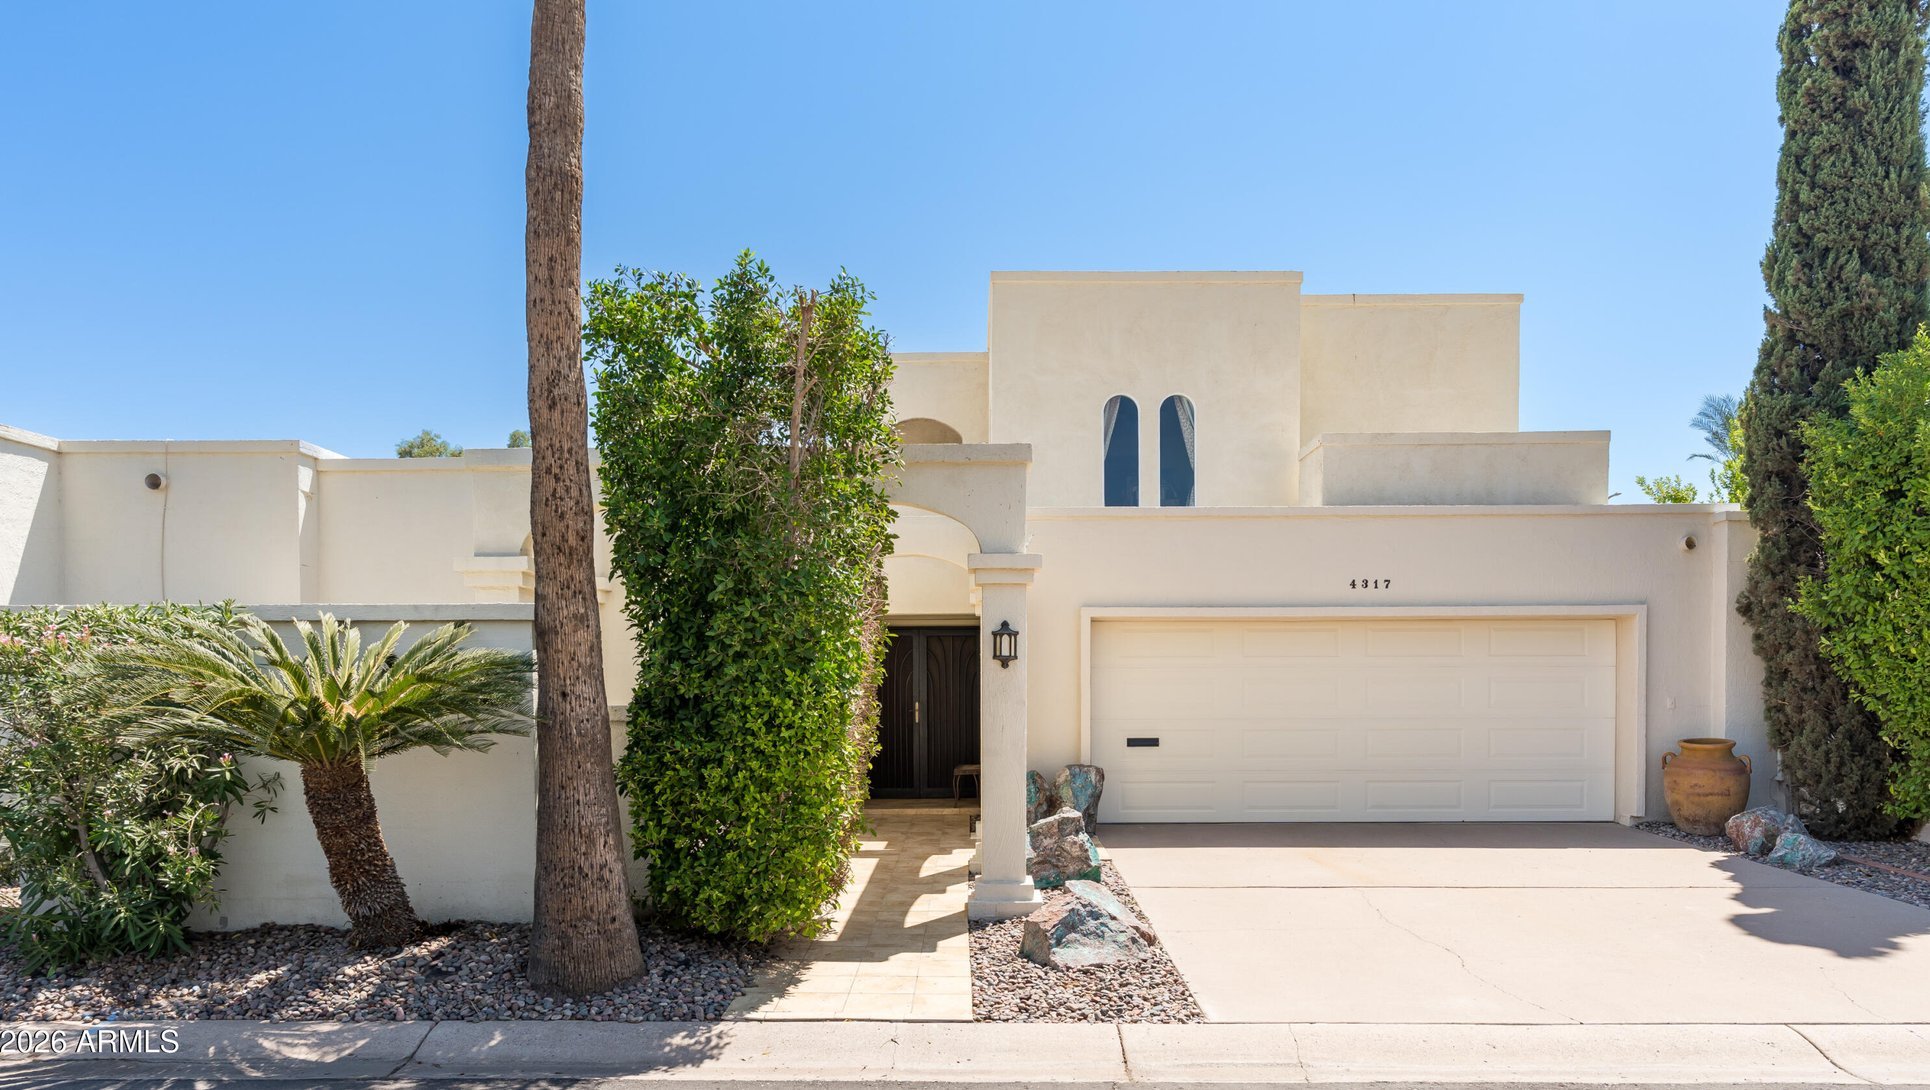
Check out my current listing in Villa Adrian.
Currently listed at $1,225,000
What Buyers Are Walking Into Right Now
September's numbers give buyers more room to compare properties, but financing costs are becoming a larger part of the decision.
At 4.45 months of supply, the broader ARMLS market is carrying 31.45% more supply than it was three months earlier, when the figure was 3.39 months. That is a meaningful change in available inventory relative to the pace of sales.
I would use that additional selection to compare homes carefully rather than assume every seller will accept a substantial discount.
A property that has been on the market for 90 days with multiple price reductions deserves a different negotiation strategy than a newly listed home priced in line with recent comparable sales. The asking price is only one part of that evaluation.
Condition matters, particularly when comparing remodeled and original homes. Buyers should also examine lot position, floor plan, HOA restrictions, and the cost of improvements they may need to make after closing.
Mortgage rates make those calculations more important. A buyer purchasing at a lower price may still face a higher monthly payment if financing costs have increased. I would want buyers to compare actual monthly ownership costs and financing options before deciding how much a price reduction really saves them.
September creates opportunities for prepared buyers, especially where a seller has already adjusted their asking price. But I would still evaluate each property on its own merits rather than treat a slower market as a reason to submit an aggressive offer on everything.
What Sellers Need to Understand About September
September's numbers make a stronger case for accurate initial pricing than August's did.
New listings increased 15.03% from the prior month, active inventory increased 7.86%, and under-contract activity declined 10.39%. Buyers have more alternatives, and fewer are committing to purchases.
That combination creates a problem for sellers who rely on older comparable sales or assume buyers will negotiate from an ambitious asking price.
There is an interesting distinction in the ARMLS pricing data. The median asking price of newly listed homes increased from $460,000 in August to $475,000 in September, a 3.26% increase. Meanwhile, the median price of homes that actually closed rose only 1.12%, reaching $450,000.
Those are different groups of properties, so I would not interpret the $25,000 difference as a direct measure of overpricing or negotiation discounts. But it does show why asking prices and completed sales need to be evaluated separately.
The average new-list price also increased sharply, rising 10.58% to $720,666. That is a much larger change than the median and may reflect a different mix of properties entering the market, including more expensive homes.
For a Scottsdale seller, I would focus on what a buyer can purchase at the same price point today. If several comparable homes offer updated interiors, better outdoor spaces, or more functional floor plans, those alternatives will influence how buyers evaluate your property.
September's 29.0% metro price-reduction share shows how common adjustments have become. A seller who starts at a defensible price may be better positioned than one who spends the first several weeks testing a number the market will not support.
Scottsdale Luxury Market Perspective
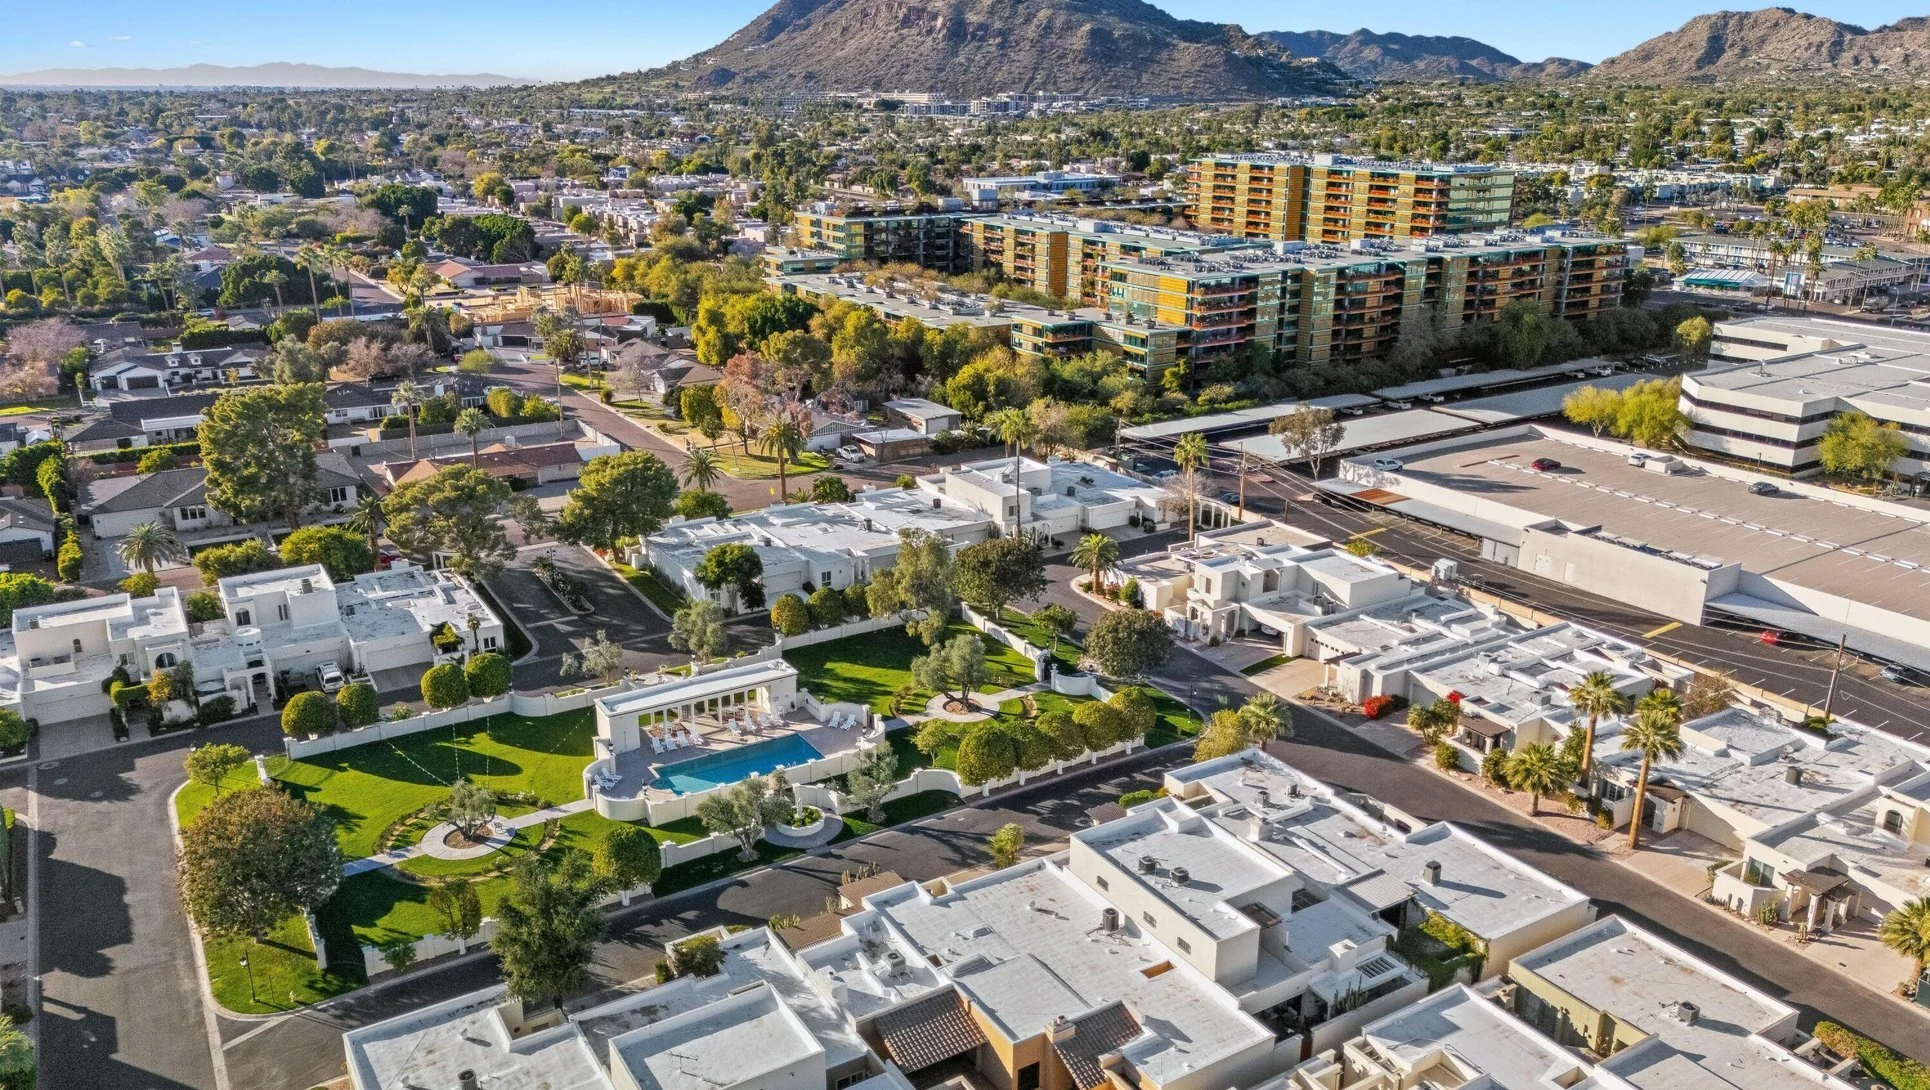
September's broader market conditions are particularly relevant to luxury real estate, where the buyer pool is smaller and individual property characteristics have a greater influence on value.
The September ARMLS report does not separate Scottsdale luxury transactions from the overall market. Realtor.com's national September report also does not provide a new Phoenix-Mesa-Chandler luxury pricing breakdown comparable to the August luxury report.
That means I would not use September's $450,000 ARMLS median sales price or the metro's $475,000 median asking price to draw conclusions about multimillion-dollar homes in Scottsdale or Paradise Valley.
What we can observe is that the broader market has more inventory, fewer properties under contract, and a higher share of price reductions. Those conditions matter when evaluating a luxury listing, but their impact depends on the property's direct competition.
A $1.5 million remodeled home in Scottsdale Country Club operates in a different segment than a $5 million estate in Paradise Valley. The buyer expectations, available alternatives, and importance of architectural quality are not the same.
I pay particular attention to properties that are difficult to replace. Architectural design, privacy, lot orientation, mountain views, and renovation quality can all influence how buyers compare homes at higher price points.
For luxury sellers, I would want to understand how many genuinely comparable properties are available, how long those properties have been listed, and whether their asking prices have changed.
For buyers, I would look beyond the advertised price and examine recent closed transactions, competing inventory, and the property's long-term appeal.
September's broader market data supports a more selective buying environment. It does not establish that every luxury home is losing value or that every seller has become more negotiable.
What I Am Watching Going Into October
The first number I want to see in October is under-contract activity.
September's 10.39% monthly decline was substantial, especially after August had shown an improvement. If that decline continues, it could translate into weaker closings later in the fall. If pending activity stabilizes, September may prove to have been a particularly difficult month for buyers adjusting to higher mortgage rates.
The second is inventory. Active listings increased by 1,841 properties in September. I want to see whether that growth continues into October or whether new listing activity begins to slow seasonally.
The third is pricing. Nationally, price reductions reached their highest monthly share since October 2022, while the Phoenix-Mesa-Chandler metro recorded reductions on 29.0% of listings. If those adjustments begin translating into more contracts, we may see signs of improved buyer engagement.
I am also watching mortgage rates closely. The September increase above 7% changed affordability calculations quickly, and further movement could influence how many buyers remain active through the end of the year.
September left us with a market that is still closing transactions and maintaining relatively stable median sales prices, but the leading indicators are less encouraging. Inventory is growing, the absorption rate is falling, and fewer properties are moving under contract.
For buyers, that creates more opportunities to compare properties and negotiate where the numbers support it. For sellers, it makes understanding current competition increasingly important.
If you're considering buying or selling in Scottsdale, Paradise Valley, Arcadia, or elsewhere in the Phoenix metro, I can break these numbers down for the neighborhood and price range that actually applies to your property.

Cody Wolfe is a real estate broker and Partner at The Agency Scottsdale, representing buyers and sellers across Scottsdale, Paradise Valley, McCormick Ranch, and Arcadia.